Let’s move on from our portainer and docker stuff. I have some computing power left in my hp. Or so I think. Would be nice to know for sure. Let’s start up a monitoring system for my home lab. So that i can measure up my servers and see if I am running out of compute power, memory or storage systems.
I had couple of options to head towards, Namely : TICK stack or Prometheus , Grafana stack.
I had seen TICK stack getting implemented when we were working on the iot management n/w for digital signage of MILB networks by my colleague avash mulmi, aka dark king , So I decided to try something newer , Went on for Prometheus and Grafana. And my friend from Pune prathamesh was an evangelist for prometheus backed solution last9.io as well. Atleast developing some promQL might land me a job in these hard times with uncertain market . Jokes apart.
Installing prometheus Prometheus is heavily used these days and second to be accepted into CNCF after kubernetes. It was developed by soundcloud. while it does have some problem with high availability as compared to InfluxDB's TICK stack and the storage of metrics might get hikarious if you are measuring too many things, ( which I intend to fix at later date ), This is pure experimental.
With two above files, in place, hit up docker-compose up -d . It should fire up nicely, You can check if the processes are up by using docker-compose ps .
Installing grafana. Add following into the docker-compose file.
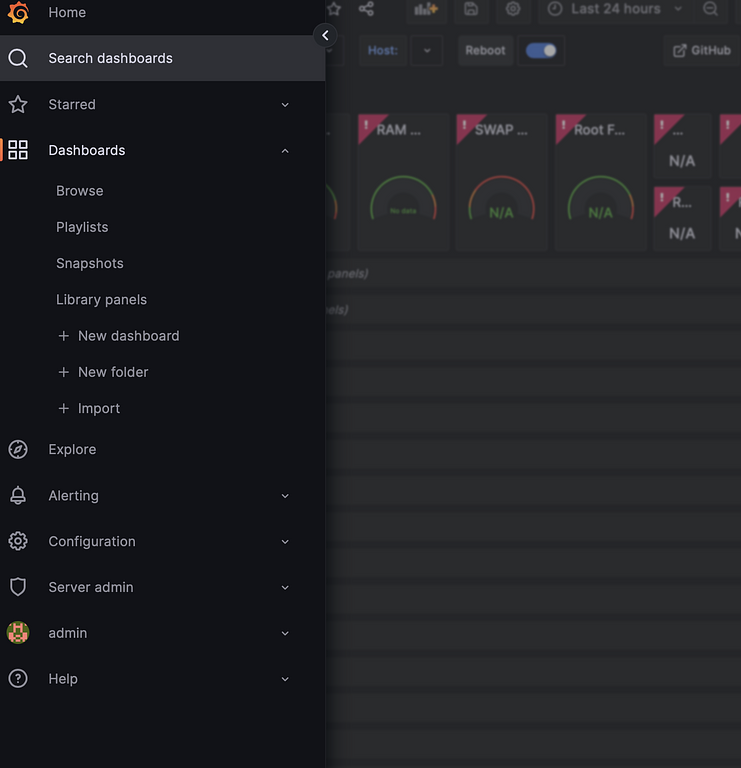
Adding in node-exporter-all-dashboard. From the right navigation panel , Click on Dashboard. Click on import
Screenshot 2023-03-01 at 17.43.33.png286 KB
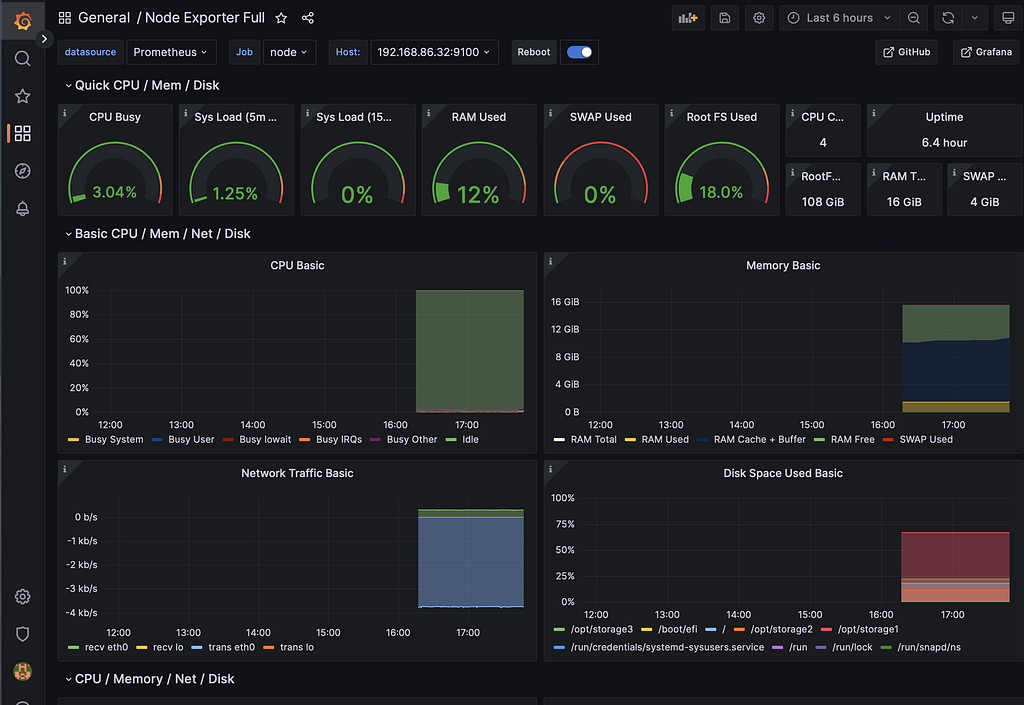
Enter ID 1860 on import this, should automatically import the dashboard. Screenshot 2023-03-01 at 17.48.11.png536 KB You can monitor your server starting here.
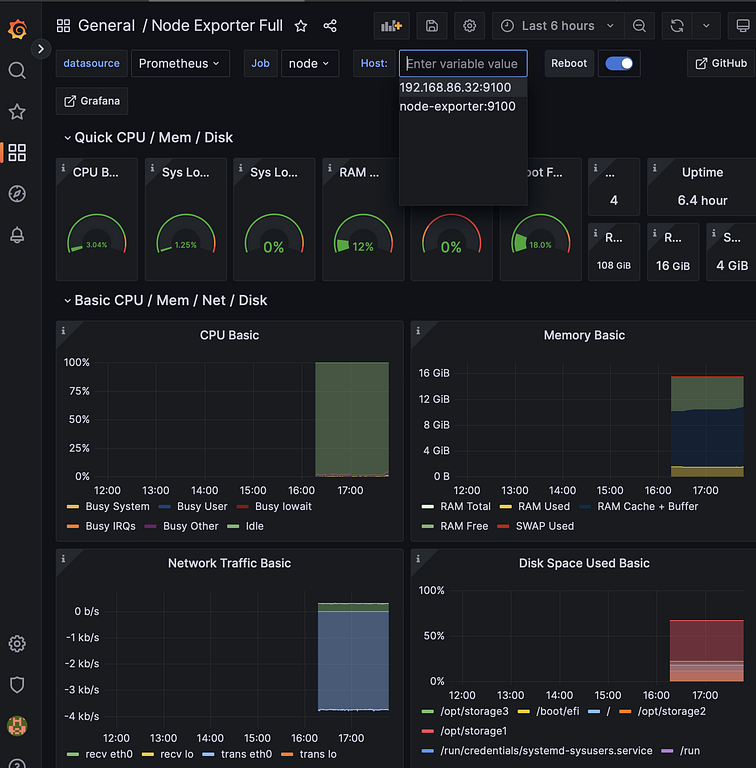
Installing node-exporter in another server host. Prometheus is designed in a way such so that we can collect metrics from many other services. Just as an example to collect from multiple targets. install node-exporter in the new host with the compose file mentioned above and update the promtheus.yml file as follows.
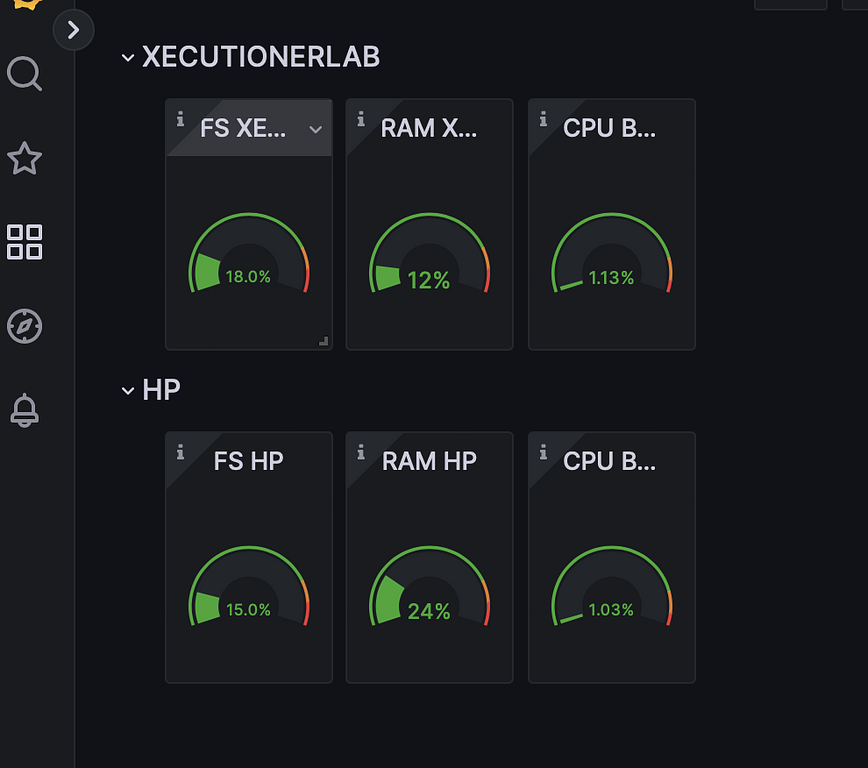
So, I tried some PromQL from inspecting these dashboard panels, And I tried building my own too. I recommend you the same to learn some basic promQL. Screenshot 2023-03-01 at 18.38.30.png103 KB
So this was it for current time. Perhaps I would want some alerting system in for some mem usage, availability , storage and cpu spikes, I’ll explore that later as my consulting work demands some attention now.